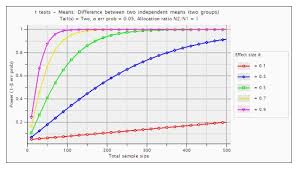
Here is the link to the spreadsheet where the data will be collected. In you "report" you should include graphs for the drops on water and the drops on the substance you chose. Compare your results to the average.
LINK!
LINK!

|
Here is the link to the spreadsheet where the data will be collected. In you "report" you should include graphs for the drops on water and the drops on the substance you chose. Compare your results to the average. LINK!
0 Comments
 Power Graphing Here is your first big-ish assignment. You will use all of the skills from past math courses to make several awesome graphs. PLUS: you can earn up to 5 extra points for making the graphs pretty - colors, doodles, interpretive stream of consciousness drawings, etc. This is due next Thursday (9.3). Each graph should take up 1 side of a sheet of graphing paper. Turn in the questions on regular lined paper. I am not printing this out because I like trees.
Pretty much ignore everything from below this point. It's from last year... |
AboutThis course is challenging. It is effectively an applied math course. You will need to know algebra inside and out. We will explore the laws and rules that make the entire universe function. Strap in, this might get crazy. Let's Go! 
Here are various documents to assist you in navigating this course.
HomeworkThis file will be continuously updated with the newest book work. Keep Checking this.
This is the Lab report Rubric. It is very different from last year in Chemistry. There is writing.
Archives
March 2016
|
||||||||
 RSS Feed
